


Trailing back to the number of attempts Edison made to invent bulbs, to the follower count of every individual, or even the number of trials made by every Coup d’Etat to overthrow the government, every single number is a revolution. Data is everything. Financial institutions need customer data for processing and analysing the information. The introduction of big data in the world of data science has completely revolutionised the functioning of financial institutions. Large numbers of transactions as well as social media have contributed decidedly to the variety and volume of data.
One of the most important aspects of Big Data is Business Intelligence, that is, the power to build data visualisation tools, location intelligence software, self-service software for non-tech consumers and analyse current data with historical data in order to append decision-making strategies and provide a competitive advantage. Above all, it’s the power of adaptability that gives data the power to define and redefine the future and if companies don’t stay parallel with technology it is often at risk of failing within a few years.
Technicalities are sometimes transcending. Let’s see how playing with python (it’s quite safe here), spoon-feeding the machine and a little statistical analysis can go a long way in making us a little too tech-savvy.
But before we begin, a simple mind map to get things started.
Suppose you haven’t figured out what profession to take up in the future (which is absolutely fine!). Let this target function be described as f ( ) Empty but there is a functional goal. In order to fill this space, you need some input to map to it. Passion, interest, dedication, learning, application of knowledge, resources and research are required just in your favourite domain. Example finance, economics etc. and let this be described as variable x. So, for every value of x, there is an outcome definitely. If you found a deep interest in mathematics, you have a wide variety of options for becoming an analyst, professor, researcher etc which is variable y. And thus, y = f(x) which is to learn the mapping technique to make predictions of y for a new x and this is the art of Machine learning. This approach is the beginning of ML known as predictive modelling or predictive analytics.
This article is going to map finance and Data science and let’s find the answer to Why? And variable y.
Finance is one of the most crucial sectors in the world. Finance management in the past used to require a lot of effort and time. But with the help of Data Science, one can quickly analyse finance and make a better decision to manage finance.
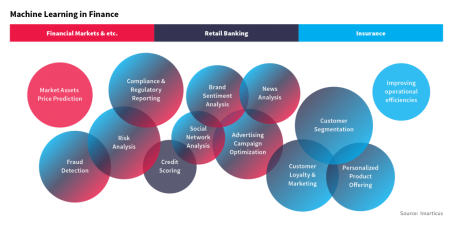
MACHINE LEARNING IN THE FINANCIAL WORLD
Over the years, a lot of videos from social media and our very own teachers have taught us about finance and the extensive network associated with it. But what would happen if we teach it to machines? Up to what extent would it help us? One of the essential parts of financial institutions is Big Data. It has wholly revolutionised Data Science and Algorithmic Trading in a much bigger way, leading to a complete change in the functioning of the industry.
Who wouldn’t want simplification of the process of product marketing, accurate sales forecast, and systematic and strategic financial decision making? All these are derived from data – past, present and what the future holds and above all analysis of what the y’s could be. Be it, whether customer satisfaction is present, the flexibility of sales strategies with changing trends or deciding investment goals based on market conditions is a predictive and tedious process but through algorithms like decision trees, graph analytics, linear and logistic regression which are fairly like building a house from scratch, is going to help for the next few decades. So If we feed our understanding and data to the machine, just like explaining a difficult concept to a 5-year old child, the way things are processed will automatically be seen as growth over the years.
MODELS OF MACHINE LEARNING FOR MODERN APPLICABILITY ALGORITHM TRADING
Algorithmic Trading is used to compute complex mathematical formulas at lightning speed which helps in devising new trading strategies by financial institutions. Machine learning informs clients of when it is the best time to fund, sell, or lend to a customer. Massive amounts of data are streamed which are processed through algorithmic trading, and a data model is produced which describes the information about the data streams. It tells clients when to call on a loan. This type of trading technology allows for fast trading arrangements and real-time trading decisions.
PERSONALISED MARKETING
Information is an asset. More the information we know about our customers, the better the ways to market our products and services to them. In-depth intel about your customers, customer segmentation, valid personalised pricing, and Robo-advisory can be made possible with ML. Natural language processing (NLP – computer’s language to interact with humans) and speech recognition based software is handy to financial institutions nowadays for better communication with clients.
REAL-TIME ANALYTICS
In the earlier period, data were processed and analysed in batches, one by one and not in real-time. It had a huge disadvantage of data being old by the time it was processed and analysed. The decisions taken on historical data will not be very helpful or accurate. Many various industries started having a problem because they require real-time data to gain insights into present circumstances. Nowadays, due to the development of dynamic data pipelines and advancements in technology, it is possible to access the data with minimum delay now.
INSURANCE UNDERWRITINGS
Insurance companies use age-old conventional methods to expand their sales. The change in compliance and regulation views might support businesses but does not improve business functions. Data Science is being used by insurance companies
to understand the consumer to reduce losses by eliminating below zero customers, increasing cross-sale and measuring the lifetime value of a customer. With the boom in ML, millennials can expect improved speed and transparency when it comes to insurance. They are using several clustering algorithms to segregate the data and understand the cluster pattern of information. Instant access to insurance products, pricing transparency, data, product features, and a variety of other insurance requirements makes us make wise decisions without falling prey to ‘subjected to market risks’ without knowing the facts.
DETECTING FRAUDS
Suspicious activity alerts in near real-time are a game-changer for businesses in the finance industry. These alerts save time and money for companies and customers. Hidden illegal cash flow is a problem for many companies in the finance sector. ML programs offer more security for detecting and identifying abnormal operations through algorithms such as biometric analytics.
For example, In expense reporting. Individuals sometimes easily and innocently double enter expenses from one month to the next. This can cost companies millions of dollars but ML helps identify and flag repeat entries.
Let’s work on some technicalities here to see an actual working model.
Credit scoring is a supervised learning method, which is essentially a binary classification. According to the historical data characteristics of customers of various categories, a mathematical model is established to predict the default risk of lenders according to “good borrowers” and “bad borrowers”. Because of its strong interpreting ability, logistic regression (LR) is the most commonly used model in credit scoring. The formula of a logistic regression model is as follows:
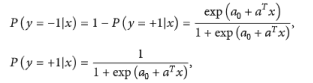
Where x belongs to Real numbers is the feature vector; p(y=+1 |x) is the probability that the eigenvector borrower x is classified as a non-defaulting customer, and p(y=-1 |x) is the probability that the eigenvector borrower x is classified as a defaulting customer. {a0, a} represents whether the model parameters are estimated by using, for example, the maximum likelihood estimation of the training dataset. Once the model parameters are estimated, the decision on the eigenvector x is recorded as Y cap = +1, if

According to the above calculation of the customer credit evaluation process, credit decision rules can be summarised as follows:

The intention is not to create a sense of alienation but the power of Machine learning on how to implement algorithms which start with building blocks of counting numbers to hypothesis testing and the process is fun and strategic.
Penultimately, ever wondered how you think of a particular product and it shows up in your feed!?
Let’s assume there is a person named Jack. He loves taking pictures at random places, loves eating chicken a lot but transfers to being a complete vegetarian for a month and just adds products on the amazon but doesn’t buy anything.
There is a data company whose task is to find useful information in the data provided and suggest inputs to clients to increase their revenue. They were doing well because of uniform and structured data collected from past data but when they came across Jack’s data they were baffled. His past experiences show not a single thing he has focused on consistently and the data is completely random. So, they hire a data scientist who analysed the data and wrote some ML models to learn about Jack’s behaviours, In a matter of weeks, the model shows some useful insights and he suggested the following points,
- He loves to travel, so let’s show him good locations which are must-visit and offer discounts.
- He does window shopping on Amazon, so let’s show him the same products from other websites with better rates.
- And he eats chicken only when he is happy so let’s show him combo offers alongside other websites he visits.
Through this, he finally bought those shoes which were in his cart for months, eats chicken when there are good offers and travels to a lot more places.
A business analyst, a data analyst and a data engineer were involved and so much information has been gathered just with the knowledge of algorithms and data wrangling.
Our human mind involuntarily aligns our thinking to the things we want. And, the machine mind remembers them all, thus it’s not weird when our suggestions are what we wanted, it’s machine learning.
To wrap up
Risk is involved in every business but it is essential to analyse the risk before making a decision. Risks from the markets, competitors, credits etc are unavoidable but are manageable. The first step is to identify the threat, monitor and prioritise the risk which is done through business intelligence and risk analytics using ML and data science tools which solve 70% of the problem and it all starts with collecting data. Data is the foundation of all aspects. It is the touchstone for everything. The Information Revolution warrants minute data. Data Science comes into play whenever there is a need to generate data, to capture all the available information.
Data is in a raw, unprocessed, non-readable format. Analytical tools applied coherently, make Data & Information complementary to each other. Data is measured in Volume, Information in units of quantity, time. The components of D.S. are Programming, Statistics and business knowledge. The above 3 make up a Data Scientist. He knows Programming but is not a Programmer. He knows Statistics but is not a Statistician. He knows Business, but not a Businessman. But he is the one needed by all.
The whole point of this article is to provide a world view of every small aspect around us. Be it various research reports we come across, news articles etc on the top reading helps us in the current affairs section but taking a step back to delve into the data involved gives us a whole new perspective. Diversification and then streamlining our goals, our visions helps in creating a unique view. Some are tech-savvy some are tech paralysed but acquiring a skill set out of our comfort zone helps indirectly in different situations. Take machine learning and deep learning. It’s just
matrices and calculus. But the breakdown learned over the years gives our minds the ability to break down different cases and problems and feed in the solution in a more diligent manner. At the end of the day who wouldn’t want an efficient accountant or a banker?
In conclusion,
- Define a problem.
- Don’t be afraid to explore your data
- While analysing data, keep your goals in mind
- Presentation matters
- Come up with solutions
- Model data if you need to, not if you want to
And keep looking out for problems! Because problems are the only solution to become a game-changer.
TRUST THE PROCESS!
Edited by Shon Kipgen
CITATIONS
- Fan, Shuangshuang, et al. “Improved ML-Based Technique for Credit Card Scoring in Internet Financial Risk Control.” Edited by Min Xia, Complexity, Hindawi, 4 Nov. 2020, https://www.hindawi.com/journals/complexity/2020/8706285/#model-and-evaluati%20on-metric.
- Prażuch, Wojciech. “11 Examples of Data Science in Finance.” Custom Software Development, Netguru, 2021, https://www.netguru.com/blog/data-science-in-finance
- Schweser, Kaplan. “Applying Data Science in Finance.” CFA, CAIA, and FRM Study Materials from Kaplan Schweser, 12 Apr. 2021, https://www.schweser.com/fdp/blog/data-science-in-finance
Kumari, Riya. “Top 10 Data Visualization Techniques with Explanation: Analytics Steps.” Top 10 Data Visualization Techniques with Explanation | Analytics Steps, 15 June 2021, https://www.analyticssteps.com/blogs/data-visualization-techniques.